Open Dashboard #
Users can view a selected dashboard from the list.
Steps:
- Click on any Dashboard from the left panel
- Dashboard opens on the right side
View Includes:
- Dashboard Title
- Description
- Create Visualization Button
Create Visualization #
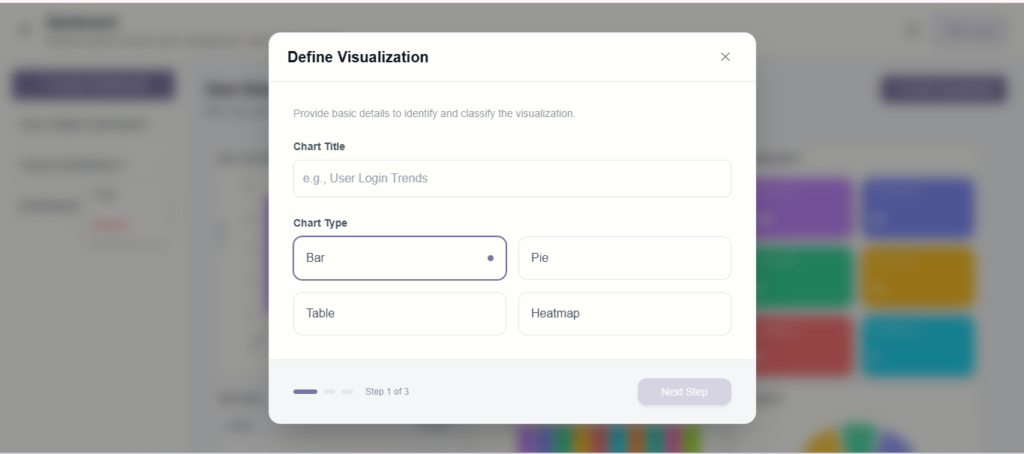
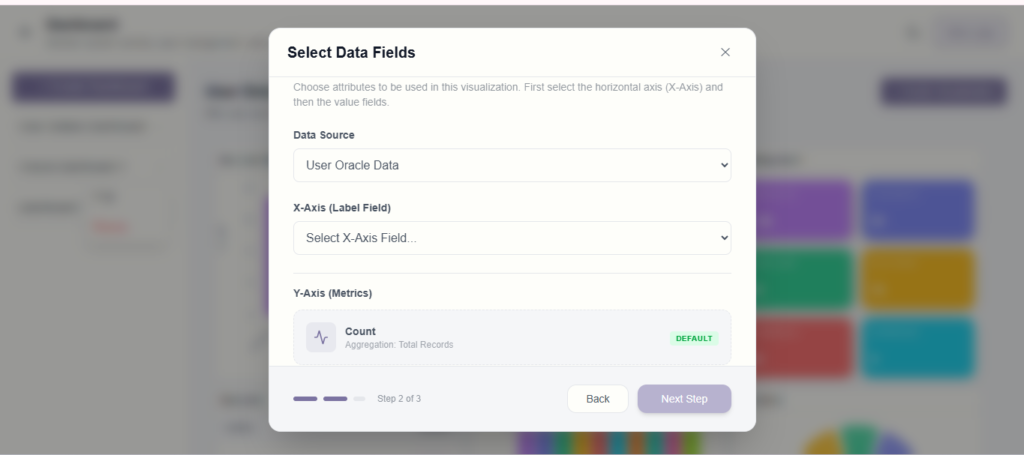
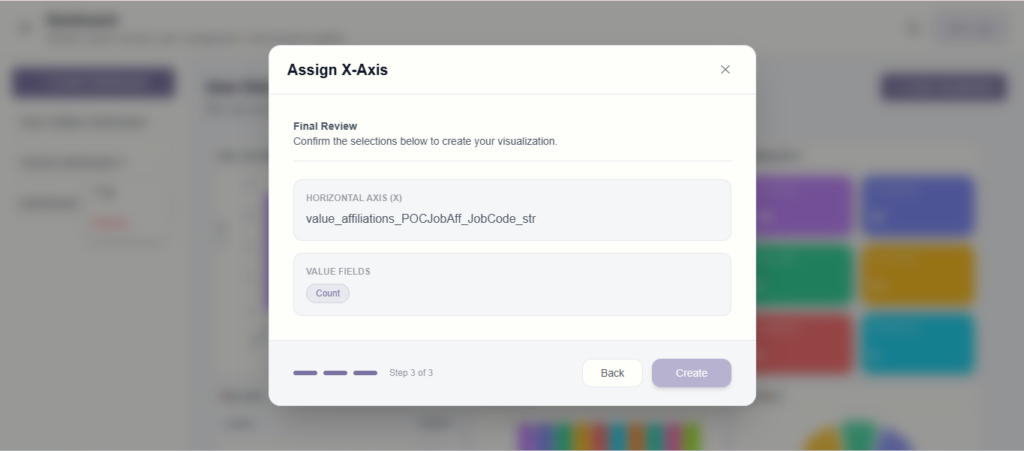
Users can add charts to the dashboard using a step-by-step flow.
Steps:
- Click on + Create Visualization
- Enter Chart Title
- Select Chart Type (Bar, Pie, Table, Heatmap)
- Choose:
- Data Source
- X-Axis field
- Y-Axis (metrics)
- Review selection
- Click Create
View Visualization #
After creation, the chart is added to the dashboard.
Result:
- Visualization appears on the dashboard
- Users can view data in chart format
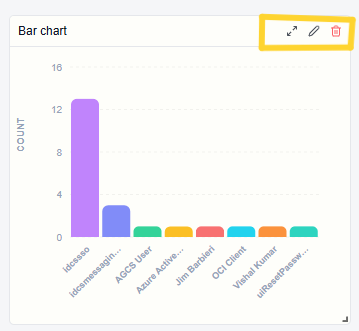
Access Chart Actions #
Users can manage individual charts from the dashboard.
Steps:
- Hover on any Chart
- Action icons appear at the top-right corner
Expand Chart #
Users can view the chart in a detailed/full view.
Action:
- Click on the Expand icon
- Chart opens in expanded view popup
Edit Chart #
Users can modify the chart configuration.
Action:
- Click on the Edit icon
- The visualization form opens (same as creating a visualization)
- Update details and save
Delete Chart #
Users can remove a chart from the dashboard.
Action:
- Click on the Delete icon
- Confirmation popup appears
- Click:
- Delete → Chart removed
- Cancel → Action cancelled